
Nour Al-Rashid, VP of Customer Experience at a mid-size Dubai electronics retailer — a composite drawn from reviews I've sat in on, not one company's dashboard — stood in front of her quarterly leadership meeting with a single slide. Human-handled support tickets had fallen from 12,000 a month to 8,400 since the AI chatbot launched. A 30 percent reduction. The room was already nodding before she finished the sentence.
Then the CFO asked the only question that mattered: "Compared to what?"
Nour had an answer ready: compared to last quarter, before the bot went live. It's the answer most AI reviews give, and in my experience it quietly overstates almost every AI win I've been asked to check. This piece is about the gap between that answer and the one you get when you build a comparison into the launch instead of assuming the before-and-after number speaks for itself.
The Before-After Trap
The math behind Nour's slide is simple enough to survive any meeting. Before the bot: 12,000 tickets a month at $3.20 average handle cost, or $38,400. After the bot: 8,400 tickets, or $26,880. The difference, 3,600 fewer tickets and $11,520 a month, became "the AI cut ticket load 30 percent" by the time it reached the executive summary.
It's a clean number, and it isn't a fabricated one. Tickets really did fall by exactly that much. The problem is what the number is silently assumed to prove: that every one of those 3,600 tickets disappeared because of the chatbot, and none of them would have disappeared anyway. A before-after comparison can tell you that something changed between two points in time. On its own, it cannot tell you what caused the change, because the two points in time differ in more than one way. Seasons shift. A UX team ships a fix the same month. A competitor changes pricing. Customers who bought heavily in a holiday spike simply need less support four months later, regardless of who answers the phone. All of that sits inside the "after" number right alongside whatever the AI actually did, and a single before-after line has no way to pull them apart.
What the Holdout Slice Showed
Nour's team, to their credit, had done one thing right before launch: alongside the 12,000 monthly tickets the bot would cover, they'd kept a separate slice of about 1,200 tickets a month (roughly a tenth the size, matched on the same customer mix and channel) routing through the old, human-only flow. No bot, same weeks, same conditions. It wasn't built as a rigorous experiment. It was built because someone was nervous about switching every customer over at once. That instinct is what made the real number recoverable at all.
In that untouched slice, tickets fell too, from 1,200 to 1,000 a month, a 16.7 percent drop. Nothing in that slice had a chatbot anywhere near it. What it did have was a post-holiday dip in returns processing and a shipping-tracker UX fix that shipped the same week the bot launched. Neither had anything to do with the bot. Whatever was pulling ticket volume down in the holdout was presumably also pulling it down in the bot-handled group. The AI was operating on top of a trend that was already moving, not against a flat baseline.
The Delta-of-Deltas: Recalculating the Real Number
This is where a holdout group earns its keep. If the same 16.7 percent decline that showed up with no AI at all was also present underneath the treated group, I can apply that rate to the full 12,000-ticket baseline to estimate what would have happened without the bot: 12,000 x (1 − 0.167) = 9,996 tickets expected, no AI involved.
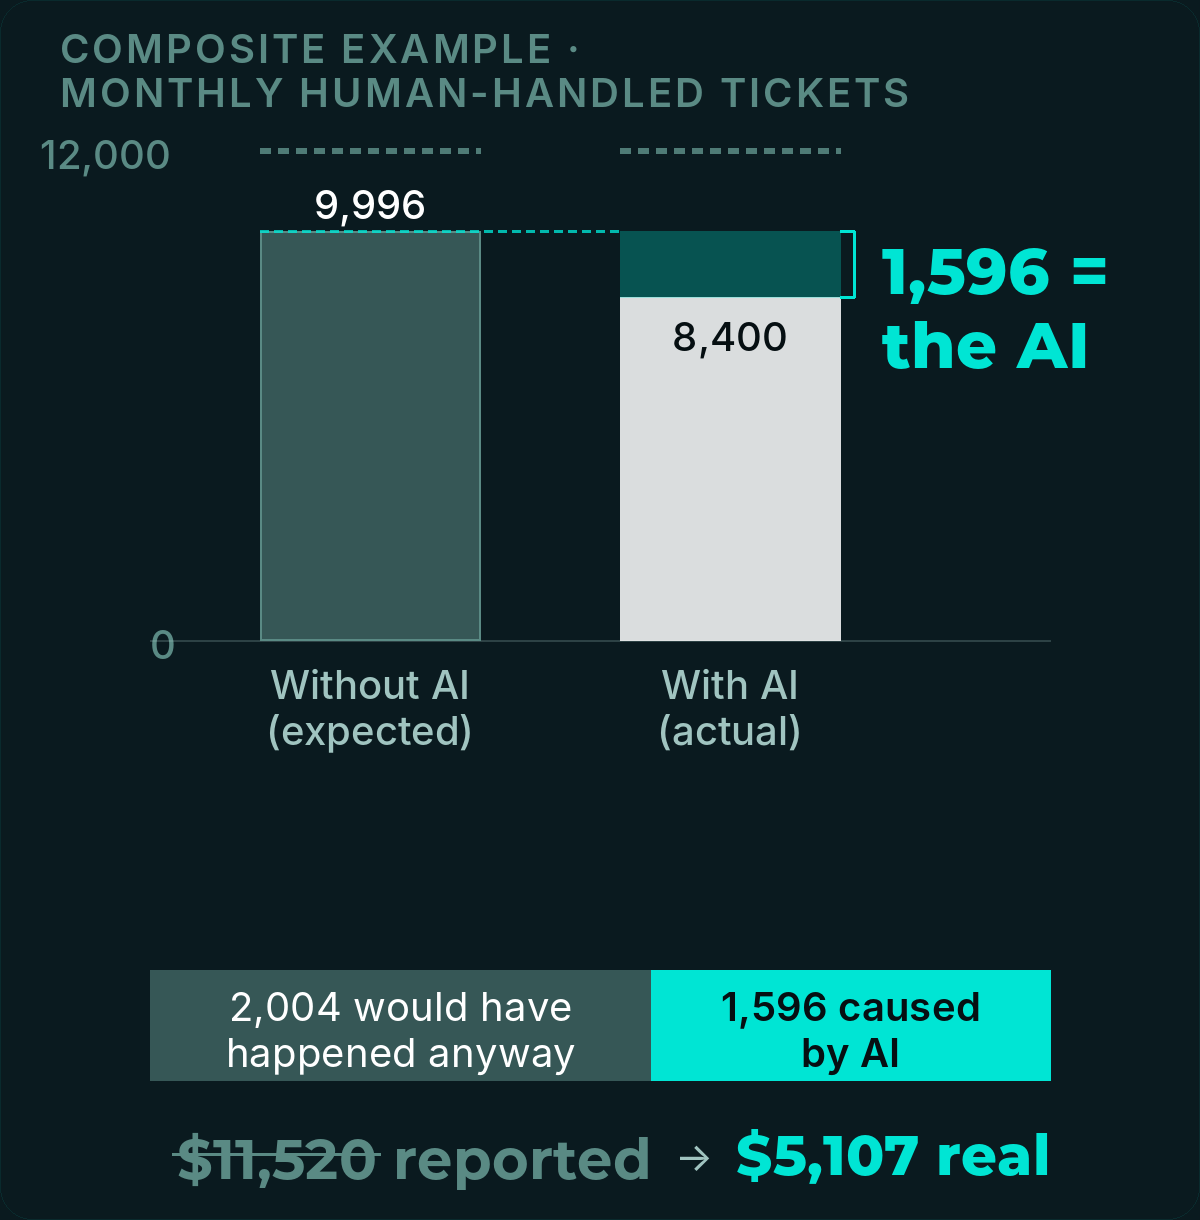
The bot's actual result was 8,400 tickets. So the reduction I can honestly attribute to the AI is 9,996 − 8,400 = 1,596 tickets a month, not 3,600. At $3.20 a ticket, that's 1,596 x $3.20 = $5,107 a month in real, AI-caused savings.
Set the two numbers side by side: $11,520 naive versus $5,107 real. The naive figure is roughly 2.3 times the AI's actual contribution. More than half of the reported win, 56 percent, was already happening before the bot answered a single ticket.
This is a different failure from two other measurement traps I've written about: whether the denominator used to calculate a percentage quietly drops the hardest cases (see The Denominator Problem), and whether freed-up hours get allocated to anything before they're called dollars (see Why I Stopped Reporting "Hours Saved" as AI ROI). Both of those pieces assume the reported change is real and interrogate what it's made of. This one asks a more basic question first: was the reported change caused by the AI at all?
Building a Lightweight Holdout Without a Data Science Team
None of this requires a statistician on staff. It requires deciding, before launch, that you will hold something back on purpose.
- Carve out a comparison slice before you launch. Set aside 5 to 10 percent of volume or users, assigned randomly or matched on the variables that actually move the metric. Never use "whoever hadn't been switched over yet," which quietly selects for the slowest-moving accounts.
- Run both groups over the identical calendar window. Same length, same season, same promotions or disruptions. A holdout measured against a different month is not a holdout.
- Compute the delta-of-deltas. Take the change in the treated group, subtract the change in the holdout group. What's left over is the AI's actual effect, not the trend it happened to ride.
- Report both numbers side by side, every time. The naive figure and the corrected figure, in the same slide, so the second one can't quietly disappear between the analyst's spreadsheet and the executive summary.
- Refresh the holdout every quarter. Once the "exception" group becomes a known, managed process, people start treating it differently: routing edge cases into it, protecting it, watching it. A holdout that everyone knows about and adjusts around stops being a clean comparison.
Nour's real number was still a win. $5,107 a month in verified, AI-caused savings is a legitimate result to bring to a board. It just isn't the number on the first slide, and the only reason she found the true figure is that someone, before launch, decided to keep a slice of the business running exactly as it always had.
For more on this and related work, see BrianServes, the platform for deploying autonomous AI e-mployees and Webspot, the AI strategy firm in Beirut.
Related evidence: The ILO's assessment of global occupational exposure to generative AI finds that its main effect is likely to augment rather than automate jobs. (ILO working paper on generative AI and jobs)
Google's Rules of Machine Learning guidance tells teams to design and implement metrics before formalising what the system will do, and to track as much as possible in the existing system first. (Google's Rules of Machine Learning)