
How do you know whether the extra output from AI is producing extra results? Compare a period before and a period after, and ask what the extra output won beyond what you were already winning. I call that the marginal yield, and the second thing to check is whether the extra output is using up prospects you cannot refill.
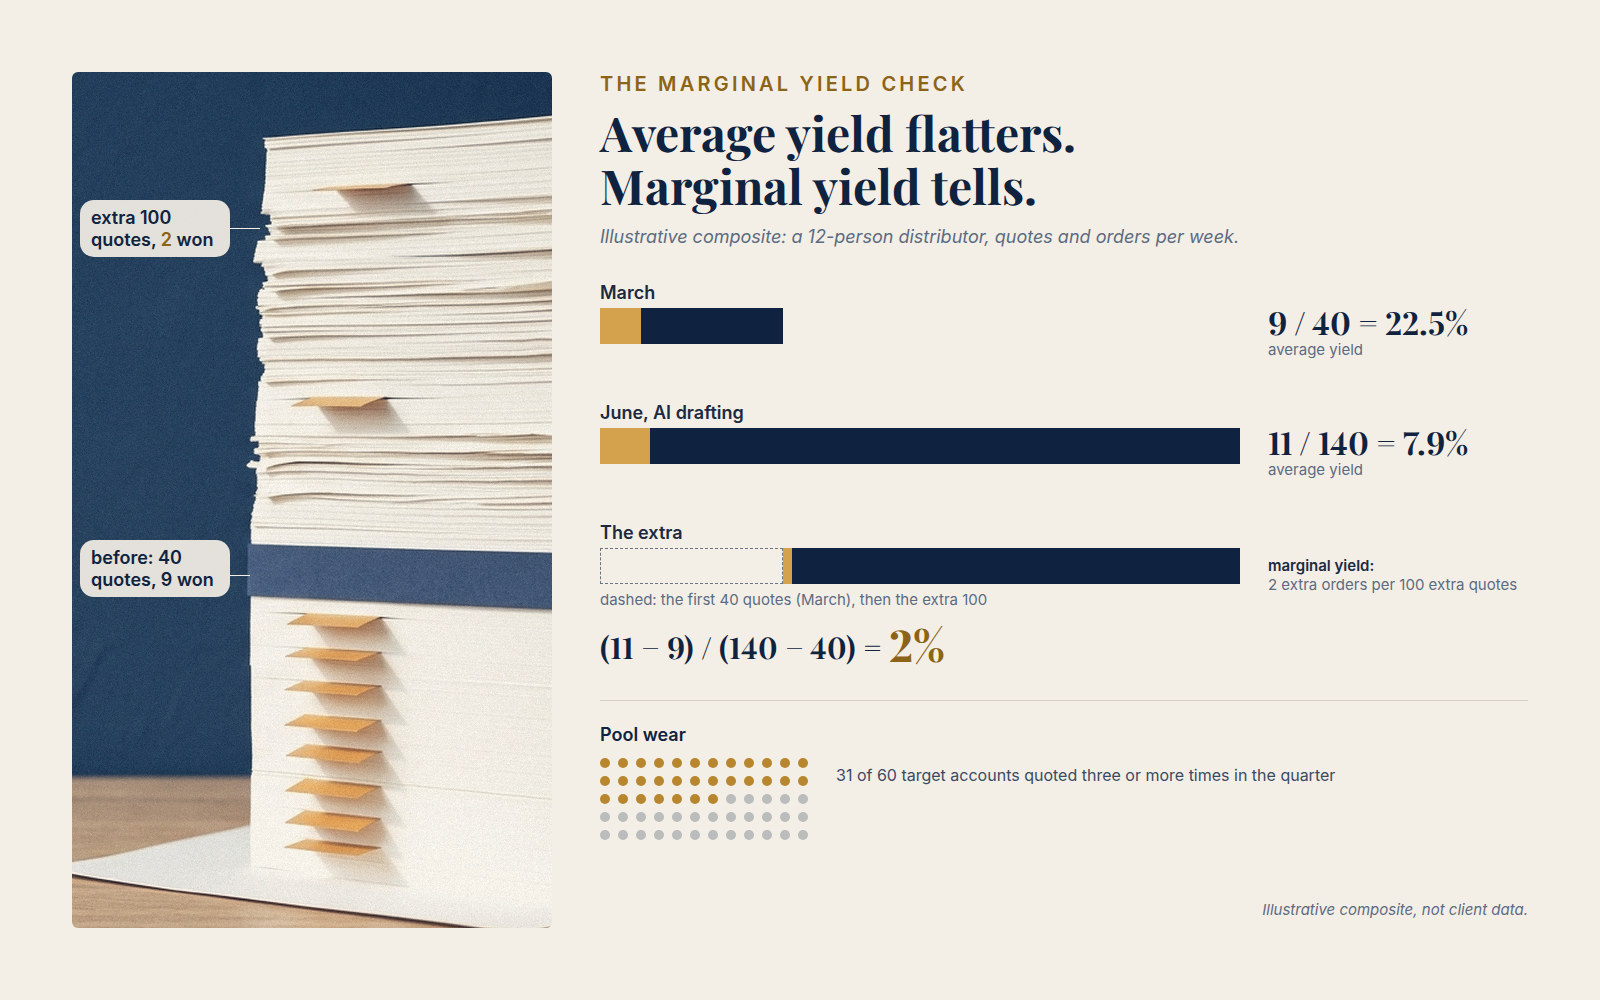
Here is the scene I use to explain it. It is an illustrative composite, not a client engagement, and every number below is arithmetic on an invented example. A 12-person industrial supplies distributor sent 40 tailored quotes a week in March and won 9 orders. In June, with AI drafting the quotes, the team sent 140 a week and won 11 orders. The sales manager's slide read "3.5x output". The owner asked a different question: "What did the extra 100 quotes win?"
The answer was 2 orders.
Why the dashboard flatters you
Output is the one number AI raises by design. A quote that used to take a long afternoon now takes a few minutes, so the team sends more of them. That is a real gain, and I want to be fair to the sales team here: they did what the tool made easy. But output is the cheapest number to improve and the one least connected to revenue.
When I look at an AI rollout, I separate three things that dashboards tend to blend together:
- Output: how much was produced and sent. Quotes, emails, posts, proposals.
- Yield: how much of it produced the result the business is paid for. Orders, qualified meetings, renewals.
- Pool wear: how much of a limited stock of prospects the output consumed along the way.
Output is easy to read off a screen. Yield needs your order book. Pool wear needs a count that almost nobody keeps. A dashboard that shows only the first will always say "more", because more is what the tool does.
The Marginal Yield Check, worked on the composite
There are three formulas, and all of them use numbers you already have.
Average yield is orders won divided by quotes sent.
- March: 9 / 40 = 22.5% of quotes won.
- June: 11 / 140 = 7.9% of quotes won.
Marginal yield is the change in results divided by the change in output.
- (11 - 9) / (140 - 40) = 2 / 100 = 2%.
Put plainly, each extra 100 quotes bought 2 extra orders. Another way to say it: it took 50 extra quotes to win one extra order. For comparison, if June had kept March's 22.5%, 140 quotes would have produced 31.5 orders, so 31 or 32. It produced 11.
Read it carefully. The first 40 quotes a week did the work. The next 100 mostly went to buyers who were not ready, did not need the product, or had already been quoted that quarter. Average yield fell, as you would expect when a team reaches colder prospects. But the average is not the useful number. The marginal figure tells you what the last 100 units of effort were worth.
This is not an argument against drafting quotes with AI. The tool genuinely lowered the cost and time of each quote. The open question is whether the saved effort was spent on the right prospects, and the marginal yield is how you find out.
Pool wear, the cost nobody prices
A prospect list is a finite stock. Every quote sent to an account spends a little of the goodwill, attention and patience that account has for you. A sales team that doubles its volume without widening its list is not reaching more people. It is reaching the same people more often.
Suppose the distributor has 60 target accounts. In the composite, 31 of those 60 were quoted three or more times during the quarter, which is just over half the list. Some of those accounts have gone silent, and a few have replied asking the team to stop. Again, this is invented to illustrate the point, not a finding. But I would expect to see its shape in many real order books: a rising count of messages, a flat count of conversations, and a list that is quietly wearing out.
That wear does not appear in this quarter's numbers. It appears next quarter, when the best accounts no longer answer. The customer relationships of a firm in Lebanon or the Gulf tend to be long and personal, so the damage from over-contact can last longer than the saving on quote-writing.
The six steps, in about 30 minutes
You need your CRM or order book and one sitting. Here is the check in order.
- Choose two windows of equal length. One before the AI, one after, from the same season if possible. Do not compare Ramadan weeks with ordinary weeks.
- Write down the output in both. Quotes, emails, posts or leads, whichever the team now produces more of.
- Write down the result you are paid for in both. Orders, qualified meetings or renewals. Not clicks, opens or replies.
- Compute average yield for each window, then marginal yield on the difference. Use the three formulas above.
- Count the pool wear. How many distinct accounts received the extra output, and how many received it more than twice?
- Make one of three decisions. Keep the volume, if the marginal yield is above what the effort costs you. Cap it, by setting a ceiling per account per month. Or redirect the saved time into fewer, better-prepared quotes.
What to tell the board
A board does not need a dashboard. Three lines are enough: the output, the average yield, and the marginal yield. In the composite those lines read 140 quotes a week, 7.9%, and 2%. Anyone reading them understands within a minute that the team is busier and the last stretch of effort is paying very little.
If the marginal yield is healthy, the same three lines will say so, and you will have earned the right to ask for more volume. Either way the number is one the team cannot inflate by working faster.
AI should make good effort cheaper. It should not make bad volume invisible. This week, take your last two comparable months and compute one marginal yield. It takes less time than the meeting where you will otherwise discuss the dashboard.
Related evidence: Goodhart's law is usually stated as: when a measure becomes a target, it ceases to be a good measure. (Goodhart's law, that a measure stops being useful once it becomes the target)
The paper describes the failure that occurs when a metric that can be used to improve a system is pushed so far that further optimisation becomes ineffective or harmful, and notes that AI's added optimisation power makes this especially critical. (Manheim and Garrabrant's paper on Goodhart effects, where pushing a metric further stops improving the system)