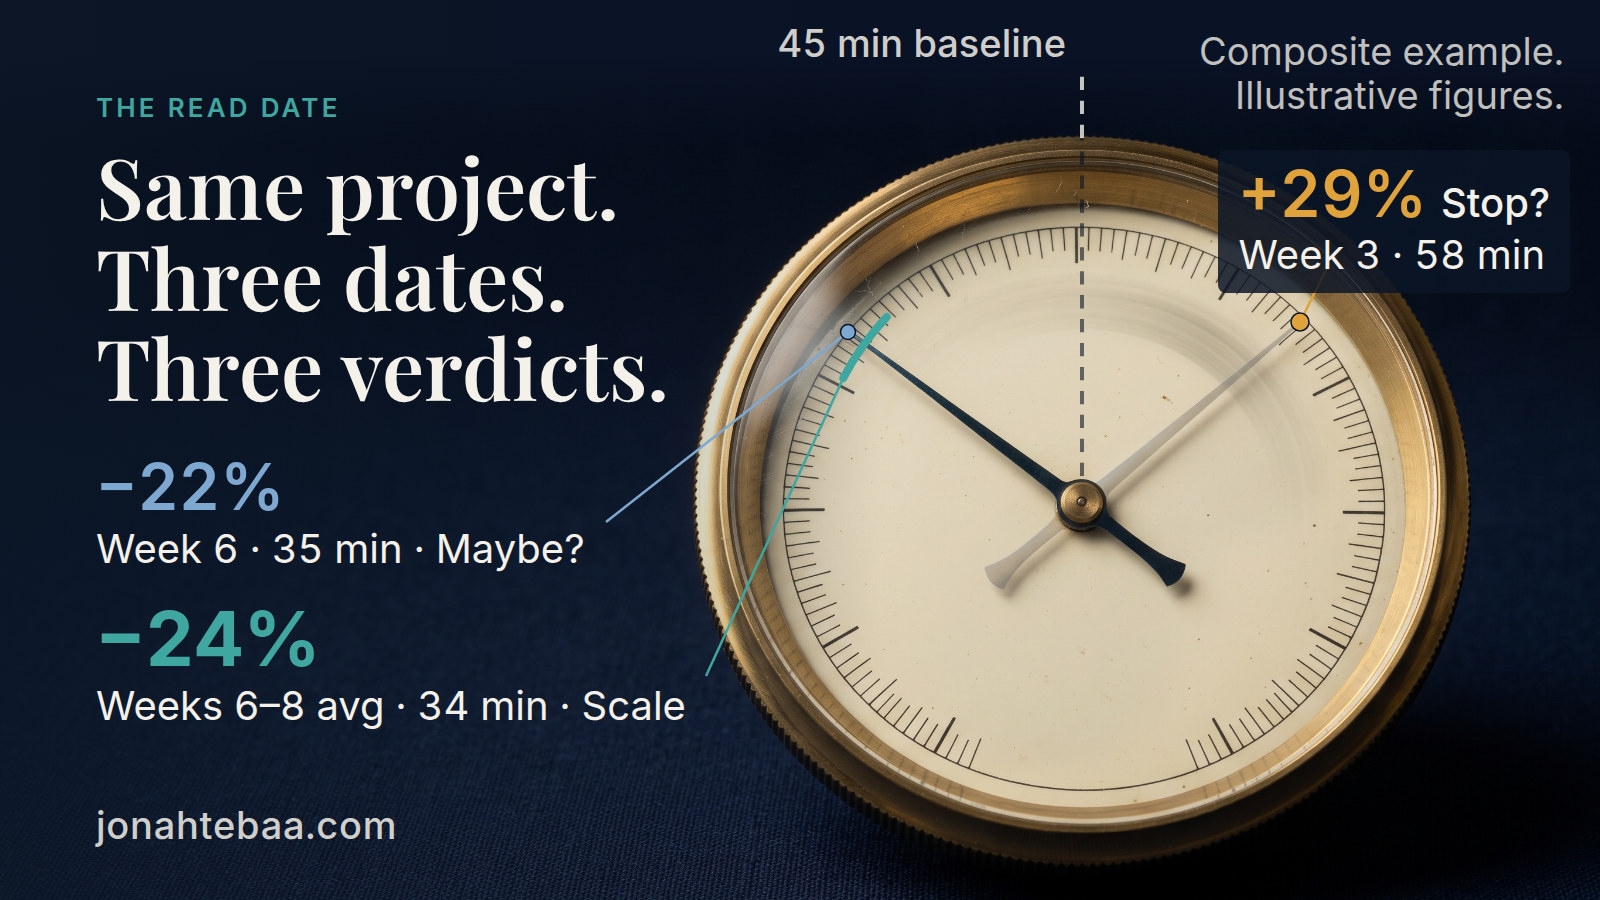
At the end of week 3, the owner of a 40-person trading company in Beirut receives a one-line message from his operations manager: "The AI made quote packages slower. Do we stop?" Before launch, preparing a supplier quote package took 45 minutes from start to finish. This week it took 58. That is 29 percent worse, on a tool he approved to make things better.
The company, the owner and every figure in this post are an illustrative composite. I built them to show a method. This is not a real client and not a real case.
He can stop, or he can continue, and he has one number to decide with. My argument is that the number is not wrong, but the date is doing too much of the talking. The day you read an AI result, and the rule that picks that day, should be fixed before launch.
One Project, Three Readings, Three Verdicts
The setup is simple. The AI helps staff prepare supplier quote packages. The metric is all-in minutes per completed package, including the time spent checking and correcting. The baseline of 45 minutes was recorded before launch; I have written separately about what happens when that baseline lives only in someone's memory, so I take it as given here.
Here is how the weeks ran in this composite. Weeks 1 and 2 averaged 61 minutes, because staff checked every line and were still learning the tool. Week 3 came in at 58. Then 49, 41 and 35 in weeks 4, 5 and 6, followed by 33 in week 7 and 34 in week 8. Three readings from that run, each with the verdict an honest person would give on the day:
| Reading | Minutes | Against the 45-minute baseline | Verdict you would give |
|---|---|---|---|
| Week 3 | 58 | 29% worse | Stop. It made us slower. |
| Week 6 | 35 | 22% better | Maybe. One good week; the curve may still be moving. |
| Weeks 6 to 8, average | 34 | 24% better | Scale. It clears the threshold set in advance. |
| Best single week (week 7) | 33 | 27% better | Overstated by about 2 points. Do not report it. |
Composite, illustrative figures. Not a real client.
The same project, the same team and the same metric produced "stop", "maybe" and "scale" depending only on the week. The error runs in both directions. A pessimistic read during the learning dip kills a tool that was about to work. An optimistic read of the best week approves one on a number it will not repeat. The arithmetic of the steady window is plain: (45 - 34) / 45 = 24.4 percent better. Quote the best week and you claim 27 percent, which is a small overstatement here but a large one when the weeks swing more.
The Read Date Rule
I use five steps. This is the version you can copy into a launch document:
- Name the one unit. One all-in measure, such as minutes or cost per completed job, counting review and rework.
- Predict the shape. Write the expected dip depth, the expected dip length in weeks, and the expected steady value.
- Set the read trigger. The first official reading is allowed only when three consecutive weeks sit within 10 percent of each other, and never before week 6. Week 12 is the hard stop.
- Read the window, not the best week. Report the average of the steady weeks, never the peak.
- Pre-commit the verdict. Write the thresholds for scale, fix and stop, with the numbers that trigger each.
Applied to the Beirut example, step one is minutes per completed quote package, with checking and corrections inside the count. Counting drafts produced would have hidden the dip entirely, and then hidden the gain.
Step two is where the week-3 message changes character. Suppose the owner had written, before launch, that he expected the first weeks to run as much as 40 percent worse than baseline, a dip of about four weeks, and a steady value near 35 minutes. Then 58 minutes in week 3 is 29 percent worse, inside the dip he forecast. The message is no longer an alarm. It is a checkpoint on a curve he drew himself.
Step three is the trigger. Weeks 6, 7 and 8 read 35, 33 and 34, all within 10 percent of each other, so the trigger fires at week 8 and not a day sooner. Week 6 was allowed to exist as a number. It was not allowed to be a verdict.
Step four gives the figure to report: the average of weeks 6 to 8, about 34 minutes. Step five supplies the thresholds, which in this composite were scale at 20 percent better or more, fix between 5 and 20, and stop below 5. At 24 percent, the answer is scale, and nobody had to argue about it afterwards.
What to Write Down Before Launch, and What to Do When the Date Arrives
Before launch, one page is enough. It holds the unit, the baseline, and the three numbers of the predicted curve: dip depth, dip length, steady value. It holds the trigger and the week-12 hard stop. It holds the thresholds. And it carries a date and the name of whoever signs the page, so that nobody reads it differently later.
The reason to do this early is not ceremony. Once the numbers exist, everyone becomes a little creative about which week matters. The person who wanted the project to work finds the strong week, and the person who never wanted it finds the weak one. A date fixed in advance takes that choice away from both of them. It also makes the early dip less frightening, which matters if you are the person who must keep staff from abandoning the tool in week 2. If you want to see what people do around a new tool in those same first weeks, I looked at that in the first 30 days after an AI launch. This post is about a different question: when the number itself becomes fair to read.
When the date arrives, check the trigger, take the average of the steady weeks, and compare it with the thresholds you wrote. If the result lands in "scale", scale. If it lands in "fix", you have a specific gap to close, and the page tells you how big it is. If it lands in "stop", stop without reopening the argument.
The harder case is the curve that has not flattened by week 12. That is itself the finding. A tool whose results are still swinging after twelve weeks is not stable in your process, and extending the pilot by default only moves the verdict to a day you will choose after seeing more numbers. Decide between fix and stop using the thresholds. If you do extend, write down the reason, the change you are making, and one new date.
Back to the owner and his week-3 message. The calm reply is short: "Within the dip we forecast. Next official reading is the trigger, not before week 6. Hard stop is week 12." He does not need to defend the tool, or himself. He only needs the page he wrote before launch.
Write your read date on the launch document this week.
Related evidence: Evan Miller's widely cited guide to experiment design warns that a result read whenever it first looks good is unreliable, because the significance calculation assumes the sample size was fixed in advance; his remedy is to decide the stopping point before the test starts and not believe the numbers until it is reached. (Evan Miller's guide on why the stopping point must be fixed in advance)
Brynjolfsson, Rock and Syverson's NBER paper on the Productivity J-Curve shows that a new general-purpose technology like AI needs complementary investment in new processes and skills, which leads to an underestimation of productivity growth in the early years of the technology and an overestimation later, once those investments are harvested. (the NBER Productivity J-Curve paper on why early readings of a new technology understate it)