
The board pack shows six AI initiatives. Each is funded, and they are ordered by value. Four of them go live in the same quarter, and each has a named sponsor and a date. One line is missing. All four land on the same operations team of ten people, who have 130 person-weeks in the quarter (10 people x 13 weeks). Ask the team lead what the four will take from her people, and the answer adds up to 40 person-weeks. That is about 31 percent of the team's quarter, spent on change while the normal work continues. This is an illustrative composite, not a client engagement.
The second budget a roadmap does not show
A roadmap that reaches a board carries two things: money and order. The money is in the business case. The order comes from dependencies, and I have written about that in sequencing nine proposals into three slots. A third thing is rarely on the page: the working weeks of the people who must absorb each launch.
That is a second budget, and it is paid in time rather than currency. A vendor or a project office will usually count the build: configuration, integration, testing, go-live. They are less likely to count what happens after go-live to the team whose daily work has changed. People have to learn the new way. They run the old and new methods side by side for a while. They handle the exceptions the tool does not cover. They redo work that came out wrong, and they fix the process around the tool, which is often where the real effort sits.
None of that is anyone's fault. The people who estimate the build are not the people who live with the result. But a board that signs dates without seeing this column is approving a plan on the assumption that the receiving teams have unlimited spare capacity. They do not. My view is simple: a roadmap is not funded until the people who must absorb it have the weeks.
The Landing-Load Table
The instrument I use is a single table. Teams that receive change go down the side, quarters go across the top, and each cell holds the person-weeks of that team's time the roadmap's launches will consume. I call it the Landing-Load Table. It is built in five steps, in this order.
Step 1. Name the landing team. For each initiative, list the team whose daily work changes, not the sponsor and not the project owner. One initiative can land on several teams; list each of them.
Step 2. Estimate landing weeks. Ask the landing team's own lead for the person-weeks over the launch quarter: learning, running old and new side by side, exceptions, rework. Do not ask the vendor or the project office. If the lead is unsure, take a range and plan on the high end.
Step 3. Sum per team per quarter and compare with a ceiling. The ceiling is the share of a team's total person-weeks that the roadmap may take. My default is 25 percent. Total person-weeks is people multiplied by the 13 weeks in a quarter. Lower the ceiling in the team's peak quarter, such as a financial close, a trading season or an audit, because the normal work is heavier then.
Step 4. Resolve every cell over the ceiling. There are three ways: slip a launch by a quarter, respecting the dependencies already in the plan; split it into a smaller first landing; or add capacity, such as temporary cover, and state what it costs. The table the board sees shows the result, not the first draft.
Step 5. Re-run it when a launch date moves or a team's headcount changes.
| Landing team | Quarter 1 | Quarter 2 | Quarter 3 | Ceiling |
|---|---|---|---|---|
| Each team whose daily work changes | Person-weeks taken | Person-weeks taken | Person-weeks taken | Share of the team's total, lower in its peak quarter |
A worked example: one team, one quarter
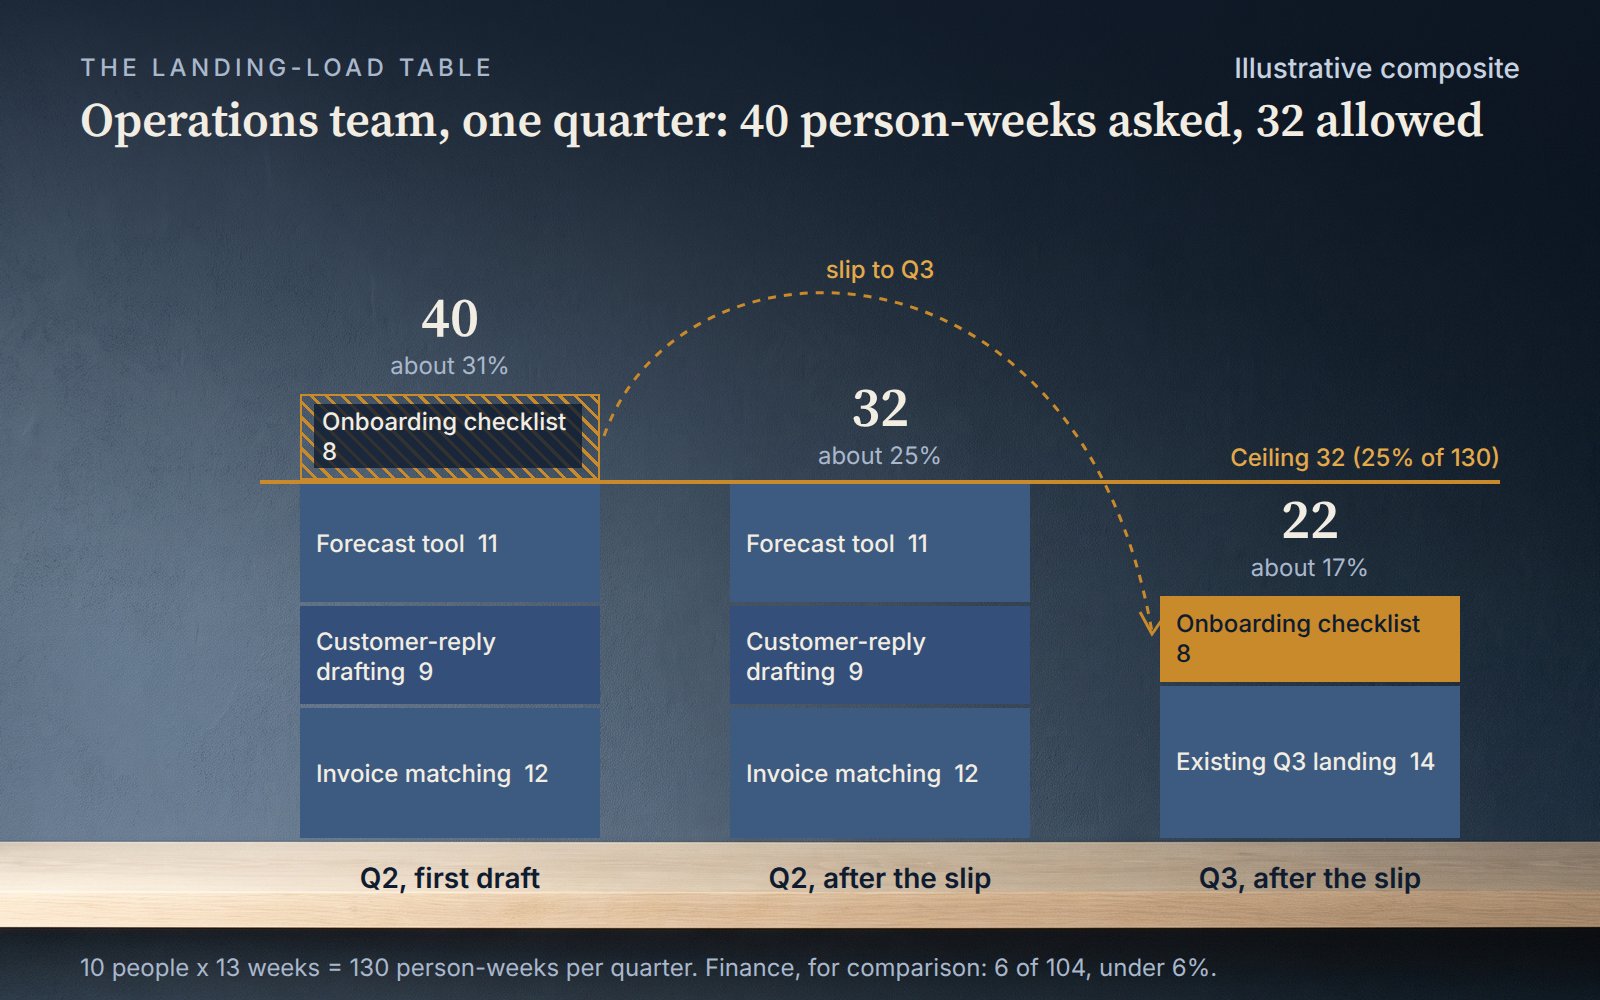
Illustrative composite, not a client engagement: a distributor of about 300 staff, shown a six-initiative roadmap that is funded and ordered by value. The operations team has 10 people, so a quarter holds 130 person-weeks. At a 25 percent ceiling the roadmap may take 32.5, which I round down to 32. The operations lead estimates the second-quarter landings in the first draft.
| Landing on operations | Person-weeks |
|---|---|
| Invoice matching | 12 |
| Customer-reply drafting | 9 |
| Forecast tool | 11 |
| Onboarding checklist | 8 |
| Total | 40 of 130, about 31 percent |
The sum is 12 + 9 + 11 + 8 = 40, and 40 / 130 is 30.8 percent. The cell is over the ceiling of 32 by 8 person-weeks. On the Gantt chart the first draft showed four green items. The table shows one team asked to give up nearly a third of its quarter to change while it runs its normal work.
The re-plan is a slip. The onboarding checklist depends on nothing else in the second quarter, so it moves to the third. Operations now carries 12 + 9 + 11 = 32 person-weeks in the second quarter, which is 24.6 percent, about 25 percent, at the ceiling. The third quarter already held one landing of 14. With the checklist it holds 14 + 8 = 22, which is 16.9 percent, about 17 percent, well under the ceiling.
For comparison, the finance team of 8 people has 104 person-weeks in the quarter and one landing of 6. That is 5.8 percent, under 6 percent, and needs no action.
The honest cost of the fix is that the checklist's benefit starts one quarter later. That is a real price, and I would show it on the same page as the table so the board chooses with both numbers in view. I would not claim more than the arithmetic supports: the example shows a load that fits the ceiling, not a guaranteed result.
Five questions for the next AI roadmap review
- Which team's daily work changes for each initiative? If the answer names a sponsor, ask again.
- Who on that team estimated the landing weeks, and did they give a range? A single confident number from outside the team is a warning sign.
- Which quarter is that team's peak, and what is its ceiling then?
- Which cells are over the ceiling, and does slip, split or cover resolve each? Ask for the choice and its cost.
- When did anyone last re-run the table? A date that has moved since the last run makes the table out of date.
What the table does not tell you
Person-weeks are estimates, not measurements. A range is more honest than a point, and the first quarter of real running will correct both. The ceiling is a judgement, not a law; 25 percent is a starting point that a team lead may fairly argue up or down.
The table does not rank value. It will not tell you which launch matters most, only whether the team that receives it has the weeks. And a team can sit comfortably under the ceiling and still lack the skill the new work demands, which is a different gap that no count of weeks will show.
The takeaway: a funded, sequenced roadmap still needs a capacity column. Before the next roadmap review, ask for one table, with teams down the side and quarters across the top, and cap it before you approve the dates.
Related evidence: The Stanford Digital Economy Lab reports that employment declines are concentrated in occupations where AI usage primarily substitutes for human tasks, while employment is flat or rising where AI usage primarily complements workers, and the authors present these as early descriptive indicators rather than causal estimates. (Stanford Digital Economy Lab employment research)
The New York Fed reports that, despite rapid growth in AI adoption among firms in its region, those firms' AI investments are generally modest, usage is concentrated among a small share of workers within firms, and layoffs have remained uncommon. (New York Fed survey of business AI adoption)