
On the eighth working day after go-live, an order landing in a distributor's exception folder would wait more than five working days. The customer behind one of them had phoned twice. The dashboard on the operations director's desk said 86% of orders had been handled automatically, and that figure was accurate.
Both facts were true at the same time. The 86% described what the software did. The five days described what the customer lived through. Nobody had set out to fail the order desk. The plan had measured the first number and never did the arithmetic on the rest: the remaining 14% of orders still had to go somewhere, and the somewhere was two clerks and a folder.
This is arithmetic, not bad luck, and it can be done on one page before anything is switched on.
The arithmetic nobody does before go-live
Illustrative composite, not a client engagement: the distributor in this post, and every figure attached to it, is constructed to show the mechanics. None of it comes from a real company.
The distributor receives 480 orders a day. The plan, built from the pilot, assumed 6% of them would be exceptions: 480 × 6% = 28.8, call it 29 a day. One clerk resolves about five exceptions an hour, but once meetings, phone calls and other duties are subtracted, a realistic day is about four productive hours, or 20 exceptions. Two clerks clear 40 a day. On paper, 29 arrivals against 40 capacity looks comfortable, with 11 to spare.
On day one the real rate is 14%: 480 × 14% = 67.2, call it 67 a day. Against the same 40, 27 more exceptions arrive each day than leave. I hold the rate at 14% for ten days so the mechanics stay visible; in practice it moves, but rarely fast enough to save the first week.
| Working day | Arrivals per day | Resolved per day | Backlog at end of day | Wait for an exception arriving that day |
|---|---|---|---|---|
| 1 | 67 | 40 | 27 | 0.7 days |
| 3 | 67 | 40 | 81 | 2.0 days |
| 5 | 67 | 40 | 135 | 3.4 days |
| 8 | 67 | 40 | 216 | 5.4 days |
| 10 | 67 | 40 | 270 | 6.8 days |
The backlog is 27 multiplied by the number of days, and the wait for a new exception is the backlog divided by 40. Nothing in the table is dramatic on any single day. Twenty-seven is a small fraction of a day's intake, which is exactly why nobody sounds an alarm. By day eight the folder holds 216 orders and an exception arriving that day waits 5.4 working days. The dashboard, meanwhile, keeps reporting 86%.
The average age of the items in the folder would sit well below that wait, and an average like that tells a calm story while a new customer waits a week.
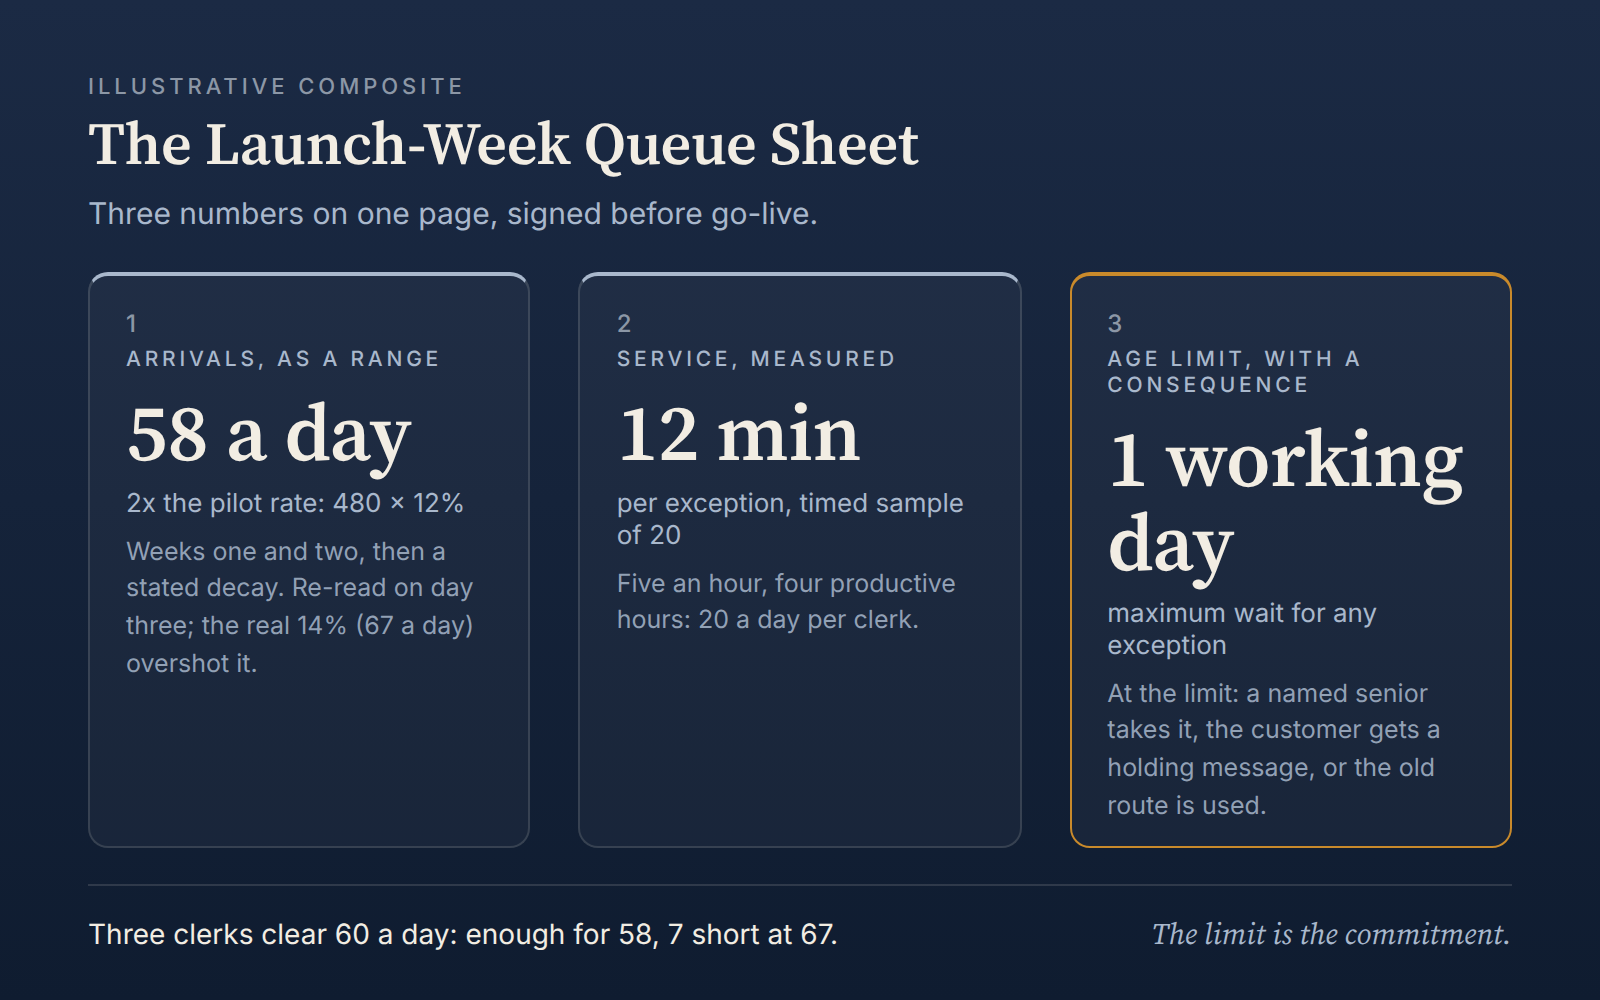
The Launch-Week Queue Sheet
In my work I ask for three numbers on a single page, signed before go-live by the person who owns the outcome and the person who owns the staffing. I call it the Launch-Week Queue Sheet.
1. Arrivals, as a range
For the first two weeks, plan for twice the exception rate you measured in the pilot, then write down how quickly you expect it to decay. The reason is one sentence: after launch, customers, document formats and cases appear that no pilot contained. In the composite, doubling 6% gives 12%, or 58 a day (480 × 12% = 57.6). That is still above the 40 the two clerks can clear, and the sheet would have shown the gap before launch rather than on day eight. The real 14% overshot even the range, which is why the sheet also names a day-three re-read.
2. Service, measured
Time a sample of 20 real exceptions from the moment someone opens one to the moment it is closed, and use that, not a meeting estimate. Then discount for people's other work. Twelve minutes each gives five an hour; four productive hours gives 20 a day per clerk.
3. Age limit, with a consequence
Set the maximum number of hours an exception may sit, and decide what happens at the limit: a named senior person takes it, the customer receives a holding message, or the old manual route is used. The limit is the real commitment. Arrivals and service are only the inputs that tell you whether you can keep it.
Suppose the composite's limit is one working day. Three clerks clear 60 a day, enough for the 58 in the range. The sheet also shows the weak point: at 67 a day even three clerks fall 7 short. That is a conversation to have in advance, not on day eight.
Before go-live, on one page
- Write the three numbers. Arrivals as a range, service from a timed sample, and the age limit with its consequence, on one page with two signatures.
- Staff to the week-one peak. Use borrowed people with a dated release, not a permanent hire made in a panic.
- Tag every exception with one cause. A rate falls by fixing causes; untagged, exceptions are only a queue.
- Show the age of the oldest item on the manager's screen, not the average.
- Set the exit trigger. Release borrowed staff only after three consecutive days under an agreed exception rate.
None of this needs new software. It needs a page, a timer and a calendar.
What to do when the queue grows anyway
It sometimes will. A new customer, a changed form or a supplier's mistake can push arrivals past any range. There are two honest options.
The first is to slow the intake: route less volume through the new process while the old route carries the rest, and restore it as the rate falls. The second is to spend on temporary capacity, which is cheaper than it sounds when it is dated and measured against the age limit.
What I would not do is let the limit slip quietly. In the composite, a one-day limit is breached on day two, when the backlog of 54 divided by 40 means an exception arriving that day waits 1.35 days. That is the moment for the decision. A limit that moves without anyone deciding to move it has stopped being a limit, and the customer discovers the change before you do.
The takeaway is short: the customer experiences the queue, not the automation rate. Tonight, write down your plan's exception rate, multiply it by your daily volume, and divide the result by what your people can actually clear in a day.
Related evidence: Little's law relates the average number of items in a system to the arrival rate and the time each spends there (L = λW); when items arrive faster than they leave, the system is unstable and the number waiting grows without bound. (Little's law, the queueing result that a system whose arrival rate exceeds its exit rate is unstable and its waiting line keeps growing)
Google's SRE book describes how a system with insufficient capacity for its steady-state load saturates its queues, so latency and error rates rise at the point of measurement while the actual cause is contention somewhere upstream. (Google's SRE book on saturated queues and cascading failure)